Global Seasonal Climate Update for March-April-May 2025
For November 2024 – January 2025 seasonal mean, except for the equatorial central and eastern Pacific, the observed sea-surface temperature (SST) anomalies in global oceans were generally above-average. The Pacific Niño SST index anomaly in the eastern Pacific (Niño 1+2) was near-zero, while the other three Niño indices were below-average, with the largest negative anomaly for Niño 3.4. Overall, the ocean and atmospheric conditions in the equatorial central and eastern Pacific were consistent with a weak La Niña. The observed Indian Ocean Dipole (IOD) anomaly was below-average. Both the North Tropical Atlantic (NTA) and South Tropical Atlantic (STA) SST index anomalies were above-average, indicating widespread warmth in the tropical Atlantic that has persisted for over a year.

For March-May 2025, sea surface temperature anomalies in the Niño 3.4 and Niño 3 regions are expected to return to near-average, indicating a neutral state in the El Niño–Southern Oscillation (ENSO). Further west, in the Niño 4 region, the sea surface temperature anomaly is also forecast to decrease to near-average. The strength of the Indian Ocean Dipole (IOD) index is likewise anticipated to be near-average. In the equatorial Atlantic, sea surface temperatures are predicted to be above average in both the northern (NTA) and southern (STA) regions.
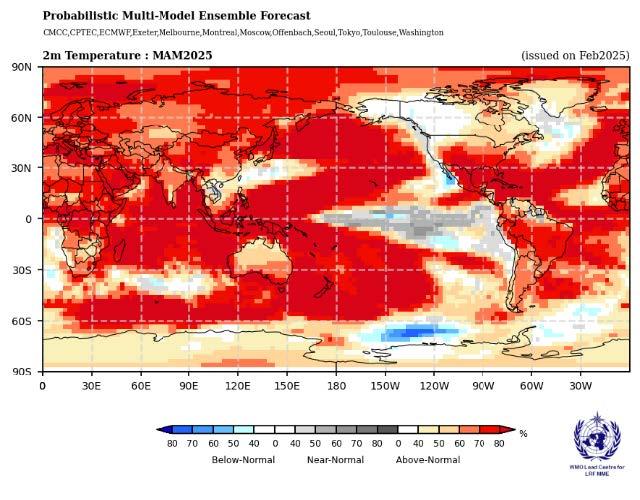
Consistent with the anticipated continuation of widespread above-normal sea-surface temperatures in all oceans, except for the near-equatorial eastern Pacific Ocean, there is a prediction of above-normal temperatures over almost all land areas. Extensive areas of increased probabilities for above-normal temperatures include most of mainland Africa and Madagascar, nearly all of mainland Asia, South America between the equator and 20°S, the Caribbean, Central America, the southern and eastern regions of North America below 45°N, throughout the western Pacific west of 160°E, and across all of Europe. Regions with a large increase in the probability for above-normal temperatures include the Arabian Peninsula, extending eastward into the northern parts of Eastern Asia, the western coastal regions of the Indian subcontinent and Southeast Asia, and a horseshoe pattern emanating from the Maritime Continent and extending north-eastward and south-eastward into the north and south Pacific. Regions with no clear indication for predicted signal include eastern parts of Southeast Asia and the northeastern regions, and western coastal parts of North America.
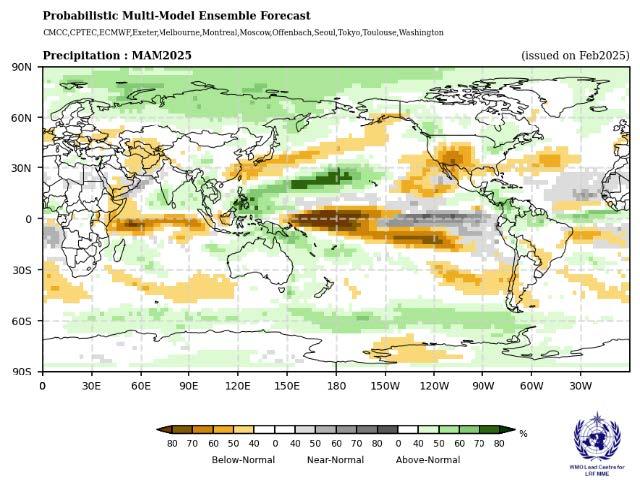
Predictions for rainfall for March-May 2025 are consistent with the enhanced positive east-to-west sea surface temperature gradient typically observed during La Niña, even though the prediction based on the Niño indices is for ENSO-neutral. Enhanced probabilities for near- or below-normal rainfall are predicted along or south of the equator, extending eastward from 150°E to the western coast of South America. Probabilities for above-normal rainfall are moderately enhanced over the central and eastern Maritime Continent. To the south, this region of above-normal rainfall probability extends to cover Australia and further south-eastward to 150°W. Except for a few small regions, there is no clear signal for rainfall prediction over Africa. There is a prediction for an enhancement in probabilities for below-normal rainfall over the southern parts of the Arabian Peninsula, extending eastward into Central Asia. Regions with an increase in the probability for above-normal rainfall are indicated in the southern part of the Arabian Sea, extending eastward into the Bay of Bengal and Southeast Asia. A region of enhanced probability for below-normal rainfall is predicted over the interior and southern regions of North America, with regions of stronger probability located in the southwest, crossing into the northern parts of Central America.