Climate change indicators reached record levels in 2023: WMO
The state of the climate in 2023 gave ominous new significance to the phrase “off the charts.”
- State of Global Climate report confirms 2023 as hottest year on record by clear margin
- Records broken for ocean heat, sea level rise, Antarctic sea ice loss and glacier retreat
- Extreme weather undermines socio-economic development
- Renewable energy transition provides hope
- Cost of climate inaction is higher than cost of climate action

A new report from the World Meteorological Organization (WMO) shows that records were once again broken, and in some cases smashed, for greenhouse gas levels, surface temperatures, ocean heat and acidification, sea level rise, Antarctic sea ice cover and glacier retreat.
Heatwaves, floods, droughts, wildfires and rapidly intensifying tropical cyclones caused misery and mayhem, upending every-day life for millions and inflicting many billions of dollars in economic losses, according to the WMO State of the Global Climate 2023 report.
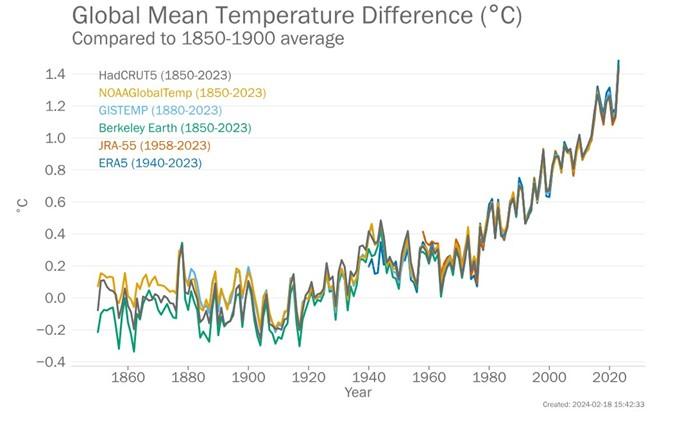
The WMO report confirmed that 2023 was the warmest year on record, with the global average near-surface temperature at 1.45 °Celsius (with a margin of uncertainty of ± 0.12 °C) above the pre-industrial baseline. It was the warmest ten-year period on record.
“Sirens are blaring across all major indicators... Some records aren’t just chart-topping, they’re chart-busting. And changes are speeding-up.” said United Nations Secretary-General António Guterres.
“Never have we been so close – albeit on a temporary basis at the moment – to the 1.5° C lower limit of the Paris Agreement on climate change.” said WMO Secretary-General Celeste Saulo. “The WMO community is sounding the Red Alert to the world.”
“Climate change is about much more than temperatures. What we witnessed in 2023, especially with the unprecedented ocean warmth, glacier retreat and Antarctic sea ice loss, is cause for particular concern,” she said.
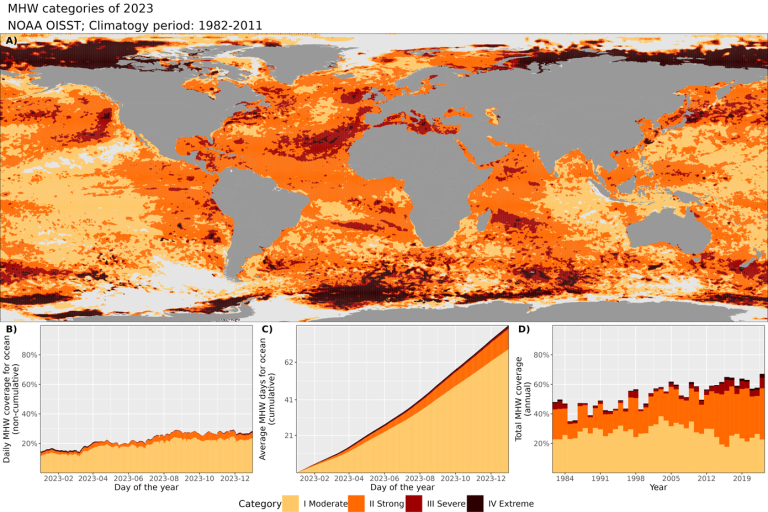
On an average day in 2023, nearly one third of the global ocean was gripped by a marine heatwave, harming vital ecosystems and food systems. Towards the end of 2023, over 90% of the ocean had experienced heatwave conditions at some point during the year.
The global set of reference glaciers suffered the largest loss of ice on record (since 1950), driven by extreme melt in both western North America and Europe, according to preliminary data.
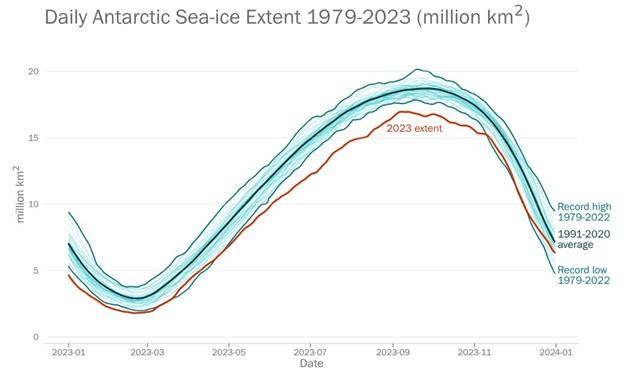
Antarctic sea ice extent was by far the lowest on record, with the maximum extent at the end of winter at 1 million km2 below the previous record year - equivalent to the size of France and Germany combined.
“The climate crisis is THE defining challenge that humanity faces and is closely intertwined with the inequality crisis – as witnessed by growing food insecurity and population displacement, and biodiversity loss” said Celeste Saulo.

The number of people who are acutely food insecure worldwide has more than doubled, from 149 million people before the COVID-19 pandemic to 333 million people in 2023 (in 78 monitored countries by the World Food Programme). Weather and climate extremes may not be the root cause, but they are aggravating factors, according to the report.
Weather hazards continued to trigger displacement in 2023, showing how climate shocks undermine resilience and create new protection risks among the most vulnerable populations.
There is, however, a glimmer of hope.
Renewable energy generation, primarily driven by the dynamic forces of solar radiation, wind and the water cycle, has surged to the forefront of climate action for its potential to achieve decarbonization targets. In 2023, renewable capacity additions increased by almost 50% from 2022, for a total of 510 gigawatts (GW) – the highest rate observed in the past two decades.
This week, at the Copenhagen Climate Ministerial on 21-22 March, climate leaders and ministers from around the world will gather for the first time since COP28 in Dubai to push for accelerated climate action. Enhancing countries Nationally Determined Contributions (NDCs) ahead of the February 2025 deadline, will be high on the agenda, as will delivering an ambitious agreement on financing at COP29 to turn national plans into action.
"Climate Action is currently being hampered by a lack of capacity to deliver and use climate services to inform national mitigation and adaptation plans, especially in developing countries. We need to increase support for National Meteorological and Hydrological Services to be able to provide information services to ensure the next generation of Nationally Determined Contributions are based on science", said Celeste Saulo.
The State of the Global Climate report was released in time for World Meteorological Day on 23 March. It also sets the scene for a new climate action campaign by the UN Development Programme and WMO to be launched on 21 March. It will inform discussions at a climate ministerial meeting in Copenhagen on 21-22 March.
Dozens of experts and partners contribute to the report, including UN organizations, National Meteorological and Hydrological Services (NMHSs) and Global Data and Analysis Centers, as well as Regional Climate Centres, the World Climate Research Programme (WCRP), the Global Atmosphere Watch (GAW), the Global Cryosphere Watch and Copernicus Climate Change Service operated by ECMWF.
Key messages
Greenhouse gases
Observed concentrations of the three main greenhouse gases – carbon dioxide, methane, and nitrous oxide – reached record levels in 2022. Real-time data from specific locations show a continued increase in 2023.
CO2 levels are 50 % higher than the pre-industrial era, trapping heat in the atmosphere. The long lifetime of CO2 means that temperatures will continue to rise for many years to come.
Temperature
The global mean near-surface temperature in 2023 was 1.45 ± 0.12 °C above the pre-industrial 1850–1900 average. 2023 was the warmest year in the 174-year observational record. This shattered the record of the previous warmest years, 2016 at 1.29 ± 0.12 °C above the 1850–1900 average and 2020 at 1.27±0.13 °C.
The ten-year average 2014–2023 global temperature is 1.20±0.12°C above the 1850–1900 average.
Globally, every month from June to December was record warm for the respective month. September 2023 was particularly noteworthy, surpassing the previous global record for September by a wide margin (0.46 to 0.54 °C).
The long-term increase in global temperature is due to increased concentrations of greenhouse gases in the atmosphere. The shift from La Niña to El Niño conditions in the middle of 2023 contributed to the rapid rise in temperature from 2022 to 2023.
Global average sea-surface temperatures (SSTs) were at a record high from April onwards, with the records in July, August and September broken by a particularly wide margin. Exceptional warmth was recorded in the eastern North Atlantic, the Gulf of Mexico and the Caribbean, the North Pacific and large areas of the Southern Ocean, with widespread marine heatwaves.
Some areas of unusual warming such as the Northeast Atlantic do not correspond to typical patterns of warming associated with El Niño, which was visibly present in the Tropical Pacific.
Ocean heat

Ocean heat content reached its highest level in 2023, according to a consolidated analysis of data. Warming rates show a particularly strong increase in the past two decades.
It is expected that warming will continue – a change which is irreversible on scales of hundreds to thousands of years.
More frequent and intense marine heatwaves have profound negative repercussions for marine ecosystems and coral reefs.
The global ocean experienced an average daily marine heatwave coverage of 32%, well above the previous record of 23% in 2016. At the end of 2023, most of the global ocean between 20° S and 20° N had been in heatwave conditions since early November.
Of particular note were the widespread marine heatwaves in the North Atlantic which began in the Northern Hemisphere spring, peaked in extent in September and persisted through to the end of the year. The end of 2023 saw a broad band of severe and extreme marine heatwave across the North Atlantic, with temperatures 3 °C above average.
The Mediterranean Sea experienced near complete coverage of strong and severe marine heatwaves for the twelfth consecutive year.
Ocean acidification has increased as a result of absorbing carbon dioxide.
Sea level rise
In 2023, global mean sea level reached a record high in the satellite record (since 1993), reflecting continued ocean warming (thermal expansion) as well as the melting of glaciers and ice sheets.
The rate of global mean sea level rise in the past ten years (2014–2023) is more than twice the rate of sea level rise in the first decade of the satellite record (1993–2002).
Cryosphere

Antarctic sea-ice extent reached an absolute record low for the satellite era (since 1979) in February 2023 and remained at record low for the time of year from June till early November. The annual maximum in September was 16.96 million km2, roughly 1.5 million km2 below the 1991–2020 average and 1 million km2 below the previous record low maximum.
Arctic sea-ice extent remained well below normal, with the annual maximum and minimum sea ice extents being the fifth and sixth lowest on record respectively.
Ice sheets: There are two principal ice sheets, the Greenland Ice Sheet and the Antarctic ice Sheet. Combining the two ice sheets, the seven highest melt years on record are all since 2010, and average rates of mass loss increased from 105 Gigatonnes per year from 1992–1996 to 372 Gigatonnes per year from 2016–2020. This is equivalent to about 1 mm per year of global sea level rise attributed to the ice sheets in the latter period.
The Greenland Ice Sheet continued to lose mass in the hydrological year 2022–2023 It was the warmest summer on record at Greenland’s Summit station, 1.0 °C warmer than the previous record. Satellite melt-extent data indicate that the ice sheet had the third highest cumulative melt-day area on record (1978–2023), after the extreme melt season of 2012 and 2010.
Glaciers: Preliminary data for the hydrological year 2022-2023 indicate that the global set of reference glaciers suffered the largest loss of ice on record (1950-2023), driven by extremely negative mass balance in both western North America and Europe.
Glaciers in the European Alps experienced an extreme melt season. In Switzerland, glaciers have lost around 10% of their remaining volume in the past two years. Western North America suffered record glacier mass loss in 2023 – at a rate which was five times higher than rates measured for the period 2000-2019. Glaciers in western North America have lost an estimated 9% of their 2020 volume over the period 2020-2023.
Extreme weather and climate events
Extreme weather and climate events had major socio-economic impacts on all inhabited continents. These included major floods, tropical cyclones, extreme heat and drought, and associated wildfires.
Flooding linked to extreme rainfall from Mediterranean Cyclone Daniel affected Greece, Bulgaria, Türkiye, and Libya with particularly heavy loss of life in Libya in September.
Tropical Cyclone Freddy in February and March was one of the world’s longest-lived tropical cyclones with major impacts on Madagascar, Mozambique and Malawi.
Tropical Cyclone Mocha, in May, was one of the most intense cyclones ever observed in the Bay of Bengal and triggered 1.7 million displacements across the sub-region from Sri Lanka to Myanmar and through India and Bangladesh, and worsened acute food insecurity.
Hurricane Otis intensified to a maximum Category 5 system in a matter of hours – one of the most rapid intensification rates in the satellite era. It hit the Mexican coastal resort of Acapulco on 24 October, causing economic losses estimated at around US$15 billion, and killing at least 47 people.
Extreme heat affected many parts of the world. Some of the most significant were in southern Europe and North Africa, especially in the second half of July. Temperatures in Italy reached 48.2 °C, and record-high temperatures were reported in Tunis (Tunisia) 49.0 °C, Agadir (Morocco) 50.4 °C and Algiers (Algeria) 49.2 °C.
Canada’s wildfire season was the worst on record. The total area burned nationally for the year was 14.9 million hectares, more than seven times the long-term average. The fires also led to severe smoke pollution, particularly in the heavily populated areas of eastern Canada and the north-eastern United States. The deadliest single wildfire of the year was in Hawaii, with at least 100 deaths reported – the deadliest wildfire in the USA for more than 100 years – and estimated economic losses of US$5.6 billion.
The Greater Horn of Africa region, which had been experiencing long-term drought, suffered substantial flooding in 2023, particularly later in the year. The flooding displaced 1.8 million people across Ethiopia, Burundi, South Sudan, Tanzania, Uganda, Somalia and Kenya in addition to the 3 million people displaced internally or across borders by the five consecutive seasons of drought in Ethiopia, Kenya, Djibouti, and Somalia.
Long-term drought persisted in north-western Africa and parts of the Iberian Peninsula, as well as parts of central and southwest Asia. It intensified in many parts of Central America and South America. In northern Argentina and Uruguay, rainfall from January to August was 20 to 50% below average, leading to crop losses and low water storage levels.
Socioeconomic impacts

Weather and climate hazards exacerbated challenges with food security, population displacements and impacts on vulnerable populations. They continued to trigger new, prolonged, and secondary displacement and increased the vulnerability of many who were already uprooted by complex multi-causal situations of conflict and violence.
One of the essential components for reducing the impact of disasters is to have effective multi-hazard early warning systems. The Early Warnings for All initiative seeks to ensure that everyone is protected by early warning systems by the end of 2027. Development and implementation of local disaster risk reduction strategies have increased since the adoption of the Sendai Framework for Disaster Risk Reduction.
The report cites figures that the number of people who are acutely food insecure worldwide has more than doubled, from 149 million people before the COVID-19 pandemic to 333 million people in 2023 (in 78 monitored countries by the World Food Programme). WFP Global hunger levels remained unchanged from 2021 to 2022. However, these are still far above pre-COVID 19 pandemic levels: in 2022, 9.2% of the global population (735.1 million people) were undernourished. Protracted conflicts, economic downturns, and high food prices, further exacerbated by high costs of agricultural inputs driven by ongoing and widespread conflict around the world, are at the root of high global food insecurity levels. This is aggravated by the effects of climate and weather extremes. In southern Africa, for example, the passage of Cyclone Freddy in February 2023 affected Madagascar, Mozambique, southern Malawi, and Zimbabwe. Flooding submerged extensive agricultural areas and inflicted severe damage on crops and the economy.
Renewable energy generation, primarily driven by the dynamic forces of solar radiation, wind and the water cycle, has surged to the forefront of climate action for its potential to achieve decarbonization targets.
Worldwide, a substantial energy transition is already underway. In 2023, renewable capacity additions increased by almost 50% from 2022, for a total of 510 gigawatts (GW). Such growth marks the highest rate observed in the past two decades and indicates, demonstrates the potential to achieve the clean energy goal set at COP28 to triple renewable energy capacity globally to reach 11 000 GW by 2030.
Climate Financing
In 2021/2022, global climate-related finance flows reached almost USD 1.3 trillion, nearly doubling compared to 2019/2020 levels. Even so, tracked climate finance flows represent only approximately 1% of global GDP, according to the Climate Policy Initiative.
There is a large financing gap. In an average scenario, for a 1.5°C pathway, annual climate finance investments need to grow by more than six times, reaching almost USD 9 trillion by 2030 and a further USD 10 trillion through to 2050.
The cost of inaction is even higher. Aggregating over the period 2025-2100, the total cost of inaction is estimated at USD 1,266 trillion; that is, the difference in losses under a business-as-usual scenario and those incurred within a 1.5°C pathway. This figure is, however, likely to be a dramatic underestimate.
Adaptation finance continues to be insufficient. Though adaptation finance reached an all-time high of USD 63 billion in 2021/2022, the global adaptation financing gap is widening, falling well short of the estimated USD 212 billion per year needed up to 2030 in developing countries alone.
The World Meteorological Organization (WMO) is a specialized agency of the United Nations responsible for promoting international cooperation in atmospheric science and meteorology.
WMO monitors weather, climate, and water resources and provides support to its Members in forecasting and disaster mitigation. The organization is committed to advancing scientific knowledge and improving public safety and well-being through its work.
For further information, please contact:
- Clare Nullis WMO media officer cnullis@wmo.int +41 79 709 13 97
- WMO Strategic Communication Office Media Contact media@wmo.int

