Greenhouse gas concentrations surge again to new record in 2023
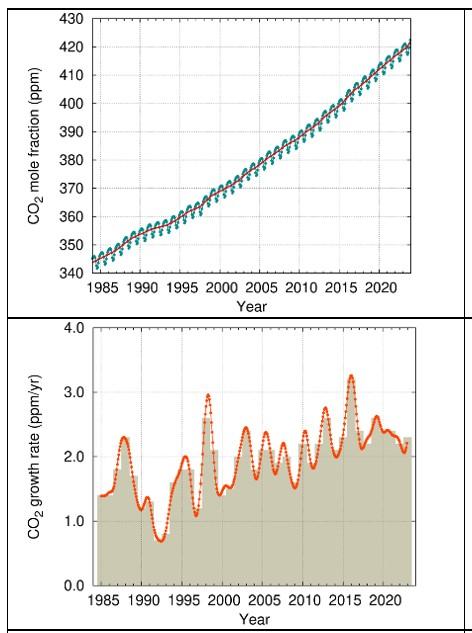
Greenhouse gas levels surged to a new record in 2023, committing the planet to rising temperatures for many years to come, according to a report from the World Meteorological Organization (WMO). Carbon dioxide (CO2) is accumulating in the atmosphere faster than any time experienced during human existence, rising by more than 10% in just two decades.
- CO2 concentrations have increased 11.4 % in just 20 years
- Long lifetime of CO2 in atmosphere locks in future temperature increase
- El Niño and vegetation fires fuel surge in later part of 2023
- Effectiveness of carbon sinks like forests cannot be taken for granted
- Improved understanding of carbon-climate feedbacks is needed

In the course of 2023, large vegetation fire CO2 emissions and a possible reduction in carbon absorption by forests combined with stubbornly high fossil fuel CO2 emissions from human and industrial activities to drive the increase, according to the WMO’s annual Greenhouse Gas Bulletin.
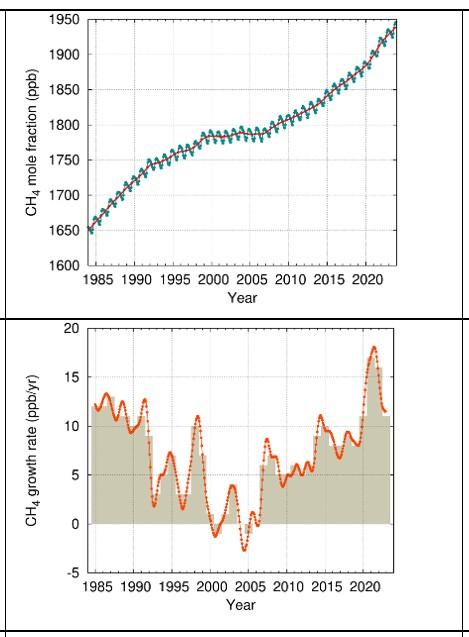
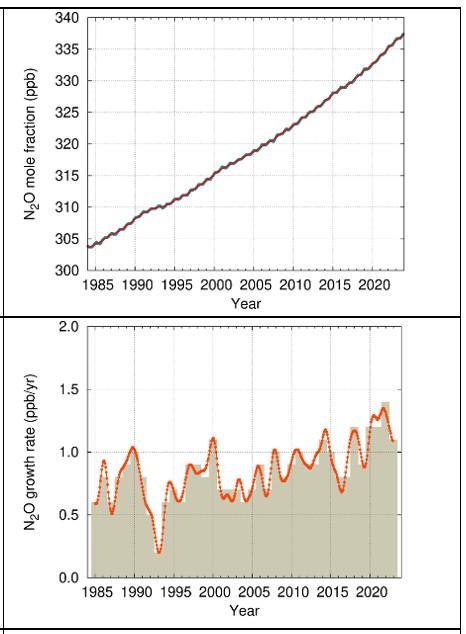
The globally-averaged surface concentration of CO2 reached 420.0 parts per million (ppm), methane 1 934 parts per billion and nitrous oxide 336.9 parts per billion (ppb) in 2023. These values are 151%, 265% and 125% of pre-industrial (before 1750) levels, it said. These are calculated on the basis of the long-term observations within the Global Atmosphere Watch network of monitoring stations.
“Another year. Another record. This should set alarm bells ringing among decision makers. We are clearly off track to meet the Paris Agreement goal of limiting global warming to well below 2°C and aiming for 1.5°C above pre-industrial levels. These are more than just statistics. Every part per million and every fraction of a degree temperature increase has a real impact on our lives and our planet,” said WMO Secretary-General Celeste Saulo.
The 2023 increase of CO2 in the atmosphere was higher than that of 2022, although lower than that of the three years before that. The annual increase of 2.3 ppm marked the 12th consecutive year with an increase greater than 2 ppm.
The WMO Greenhouse Gas Bulletin is one of WMO’s flagship publications released to inform the UN Climate Change conference, COP, and is now in its 20th issue. During that time the CO2 level has increased by 11.4 % (42.9 ppm) above the level of 377.1 ppm recorded in 2004 by WMO’s Global Atmosphere Watch network of monitoring stations.
The Greenhouse Gas Bulletin reports on greenhouse gas concentrations, rather than on emission levels. Analysis of data shows that just under half of CO2 emissions remain in the atmosphere. Just over one quarter are absorbed by the ocean and just under 30% by land ecosystems – although there is considerable year-to-year variability in this because of naturally occurring phenomena like El Niño and La Niña.
The Greenhouse Gas Bulletin complements the UN Environment Programme’s Emissions Gap report. Both were published ahead of COP29 in Baku, Azerbaijan.
During El Niño years, greenhouse gas levels tend to rise because drier vegetation and forest fires reduce the efficiency of land carbon sinks.
“The Bulletin warns that we face a potential vicious cycle. Natural climate variability plays a big role in carbon cycle. But in the near future, climate change itself could cause ecosystems to become larger sources of greenhouse gases. Wildfires could release more carbon emissions into the atmosphere, whilst the warmer ocean might absorb less CO2. Consequently, more CO2 could stay in the atmosphere to accelerate global warming. These climate feedbacks are critical concerns to human society,” said WMO Deputy Secretary-General Ko Barrett.
From 1990 to 2023, radiative forcing – the warming effect on our climate - by long-lived greenhouse gases increased by 51.5%, with CO2 accounting for about 81% of this increase, according to the National Oceanic and Atmospheric Administration Annual Greenhouse Gas Index cited in the WMO Bulletin.
As long as emissions continue, greenhouse gases will continue accumulating in the atmosphere leading to global temperature rise. Given the extremely long life of CO2 in the atmosphere, the temperature level already observed will persist for several decades even if emissions are rapidly reduced to net zero.
The last time the Earth experienced a comparable concentration of CO2 was 3-5 million years ago, when the temperature was 2-3°C warmer and sea level was 10-20 meters higher than now.


Carbon Dioxide
CO2 is the single most important greenhouse gas in the atmosphere related to human activities, accounting for approximately 64% of the warming effect on the climate, mainly because of fossil fuel combustion and cement production.
The 2023 increase of CO2 in the atmosphere was higher than that of 2022, although lower than that of the three years before that. The annual increase of 2.3 ppm marked the 12th consecutive year with an increase greater than 2 ppm, while the increase within the year 2023 was one of the largest (2.8 ppm).
The long-term CO2 increase is due to fossil fuel combustion but there are year-to-year variations due to the El Niño–Southern Oscillation, which impacts photosynthetic CO2 uptake, respiratory release, and fires. In May 2023, Earth transitioned from a 3-year long La Niña to El Niño.
In 2023, global fire carbon emissions were 16 % above average, seventh amongst all fire seasons since 2003. Canada experienced its worst wildfire season on record. Australia experienced its driest three-month period on record in 2023 from August to October, with severe bushfires.
Methane
Methane is a powerful greenhouse gas which remains in the atmosphere for about a decade.
Methane accounts for about 16% of the warming effect of long-lived greenhouse gases. Approximately 40% of methane is emitted into the atmosphere by natural sources (for example, wetlands and termites), and about 60% comes from anthropogenic sources (for example, ruminants, rice agriculture, fossil fuel exploitation, landfills and biomass burning).
The growth in atmospheric methane in 2023 was smaller than 2022 – but was record high for the five-year period. Detailed analysis indicates an emission increase from sources such as wetlands and agriculture, which could at least partly be due to on-going climate feedback that further increases greenhouse gas emissions from the natural systems.
Nitrous Oxide
Nitrous Oxide is both a powerful greenhouse gas and ozone depleting chemical. It accounts for about 6% of the radiative forcing by long-lived greenhouse gases.
N2O is emitted into the atmosphere from both natural sources (approximately 60%) and anthropogenic sources (approximately 40%), including oceans, soils, biomass burning, fertilizer use, and various industrial processes.
For nitrous oxide, the increase from 2022 to 2023 was lower than that observed from 2021 to 2022, which was the highest increase observed in our modern time record.
Notes to Editors
The WMO Global Atmosphere Watch Programme coordinates systematic observations and analysis of greenhouse gases and other atmospheric constituents. Greenhouse gas measurement data are archived and distributed by the World Data Centre for Greenhouse Gases (WDCGG) at the Japan Meteorological Agency.
A separate and complementary Emissions Gap Report by UN Environment was released on 24 October. The Emissions Gap report assesses the latest scientific studies on current and estimated future greenhouse gas emissions; they compare these with the emission levels permissible for the world to progress on a least-cost pathway to achieve the goals of the Paris Agreement. This difference between “where we are likely to be and where we need to be” is known as the emissions gap.
The World Meteorological Organization (WMO) is a specialized agency of the United Nations responsible for promoting international cooperation in atmospheric science and meteorology.
WMO monitors weather, climate, and water resources and provides support to its Members in forecasting and disaster mitigation. The organization is committed to advancing scientific knowledge and improving public safety and well-being through its work.
For further information, please contact:
- Clare Nullis WMO media officer cnullis@wmo.int +41 79 709 13 97
- WMO Strategic Communication Office Media Contact media@wmo.int

